
Development Telemetry Viewer
Tracing is the kind of thing you enable once the operational stack exists. That ordering is backwards for the loop you are in right now: the spans worth reading are the ones from the request you just broke, and standing up a collector to read them is more work than the fix.
So pw dev runs the collector for you. A loopback OTLP
receiver and a browser UI start with the developer loop, and the application is
pointed at them before it boots:
pw dev: telemetry viewer http://127.0.0.1:54321pw dev: traces and logs export to OTEL_EXPORTER_OTLP_ENDPOINT as service "myapp"Open that address. It is on by default, so this is the state of a project that has configured nothing.
How the application finds it
Section titled “How the application finds it”pw dev reserves a port, then passes three environment variables to the process
it starts:
| Variable | Value |
|---|---|
OTEL_EXPORTER_OTLP_ENDPOINT |
the viewer’s loopback URL |
OTEL_EXPORTER_OTLP_PROTOCOL |
http/protobuf |
OTEL_SERVICE_NAME |
project.name from popcornweb.toml |
These are the OTLP conventions rather than Popcorn Web names, which is the point: any exporter finds them, and no project commits a development endpoint to a file.
Notice what is missing. There is no observability.otel.enabled = true
anywhere, because naming an endpoint is what turns export on — a configuration
that says where to send traces has already said to send them. See
[observability.otel] for the
keys that do get configured, all of which still reach the
configuration summary.
What you can see
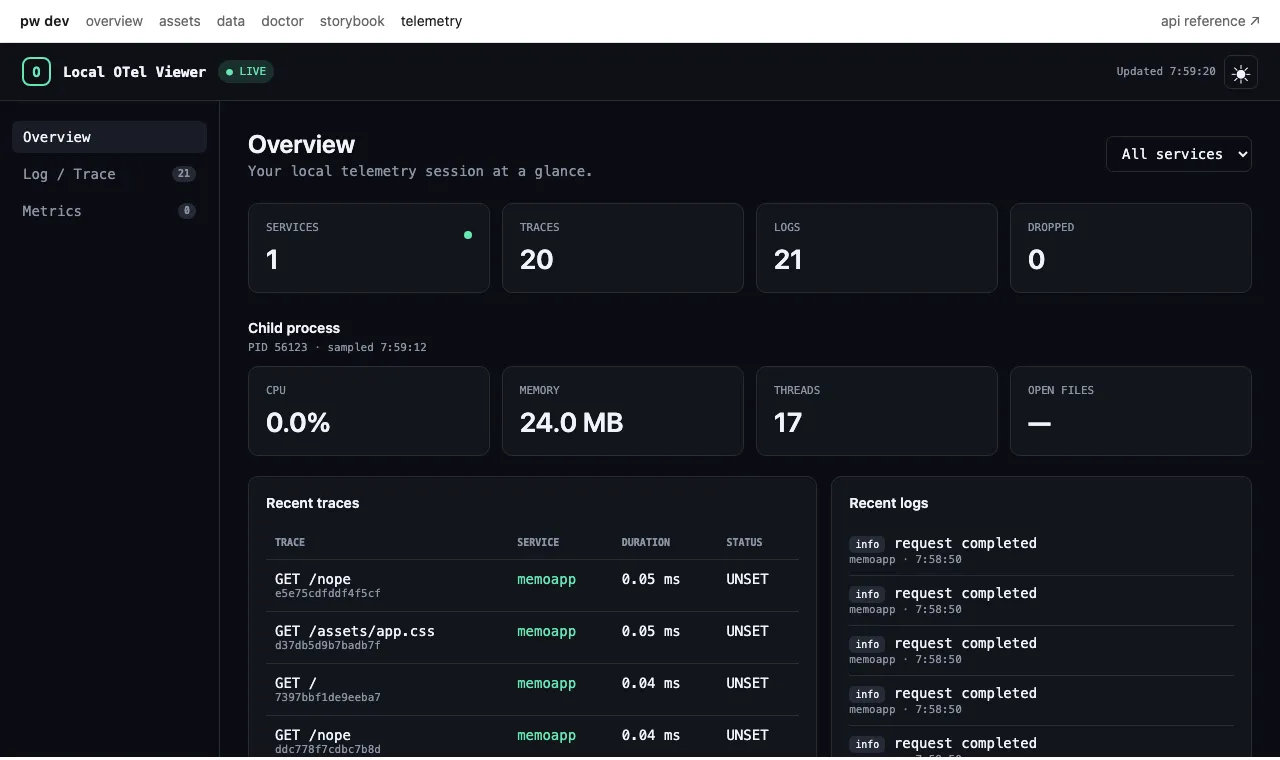
Section titled “What you can see”Traces. Every request has a root span covering the whole framework
middleware chain, and the render, boundary, and statement spans of request
tracing hang off it — the injected endpoint turns
those on with it, so a page arrives as a tree showing when the shell committed,
how long each await boundary held its
fallback, and which SQL ran inside it. Spans you open with pw.StartSpan nest
in the same tree, and recorded errors arrive with them.
Logs. Records from pw.Logger reach the
viewer correlated with the span that was active when they were written, so a
trace and its log lines are one view rather than two searches. In development
they also keep going to your terminal — everywhere else a record goes to the
collector or to stdout, but emptying the terminal is not an improvement to a
loop you are watching.
Process health. The viewer samples CPU, memory, thread count, open files,
and I/O of the application process. pw dev replaces that process on every
rebuild, so the sampler follows the new one rather than reporting a pid that no
longer exists.
Metrics. The receiver accepts /v1/metrics, but the framework emits none.
That view stays empty unless your application exports its own.
Nothing is written to disk. The viewer holds telemetry in memory and the run takes it with it, which is what makes it safe to leave on.
Configuration
Section titled “Configuration”[dev.otel]enabled = true # default# port = 0 # 0 reserves an available loopback port# max = 0 # retained records per signal; 0 keeps the viewer defaultThe port defaults to 0 for the same reason the development identity
provider’s does: the resolved address is
injected rather than written down, so a fixed number buys nothing and several
projects can run pw dev at once.
max bounds how many records each signal retains before the oldest are
dropped. Raise it when a long session scrolls the interesting request off the
top; the cost is the memory the run holds.
When it does not run
Section titled “When it does not run”Exporting to your own collector takes precedence. If
OTEL_EXPORTER_OTLP_ENDPOINT is already set in the environment, pw dev says
so and starts nothing:
pw dev: telemetry viewer skipped; OTEL_EXPORTER_OTLP_ENDPOINT already points at http://localhost:4318A viewer that nothing exports to would hold a port to display an empty page. The same rule covers every injected variable individually — a value you exported yourself is never overwritten.
Setting enabled = false is the other way, for the loop that wants neither.
Boundaries
Section titled “Boundaries”The viewer belongs to pw dev and to nothing else. It never runs under
pw build, under go test, or in a deployed
environment, and it binds to loopback only. What reaches a real collector in
staging or production is the ordinary
[observability.otel]
configuration, exporting over the same protocol to an address you chose.